Hello,
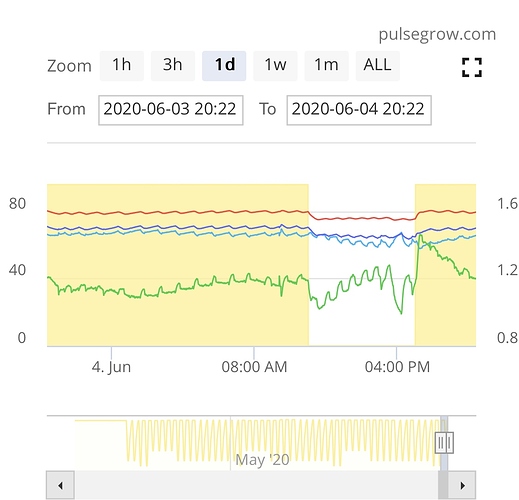
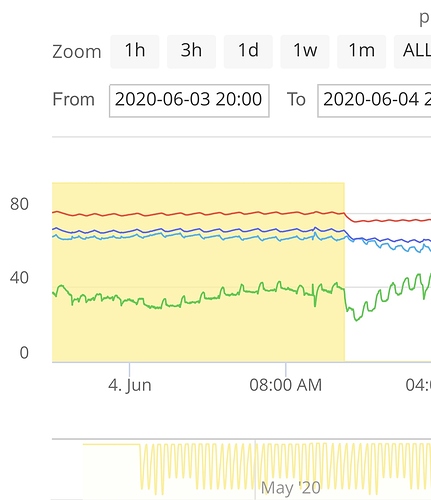
I’m finding that lately I am wanting to dig down into specific times on the chart. For example, I am only wanting to display on the chart the previous day’s night cycle (6 hour span) so I can see the averages for all the collected data only during that time frame. I really like I can do that and how it recalculates all the averages for me based on my selected time.
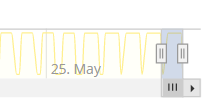
The only issue I’m having is with the slider bars under the chart that control what time frame/zoom I want. I have to fiddle with it quite a bit to get the chart to only display the night cycle. On the phone, it’s nearly impossible to drill down to a time frame that narrow, so I switch the web app, which is a little easier, but I still have to fiddle with it to get the precise time frame I’m wanting the data samples from.
This is what I’m referring to:

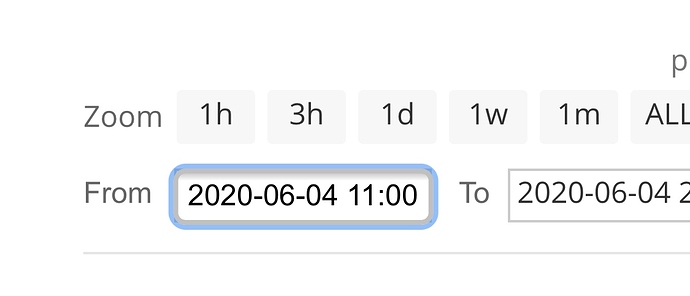
I’m not sure what can be done to make this easier from a UI perspective…perhaps we can enter the specific time frame we want?
Thanks


