Spectrum Readings

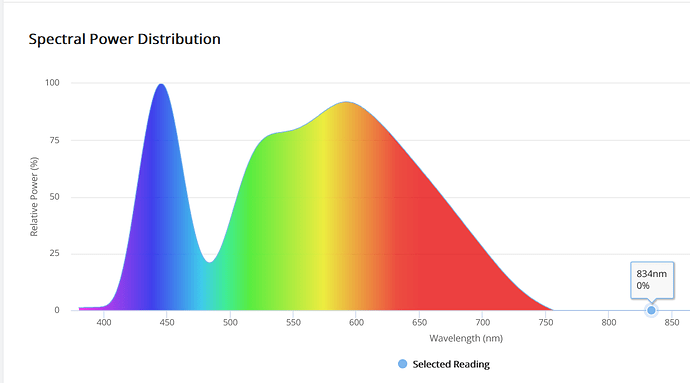
I have a HLG Scorpion Diablo I am testing with the Pulse Pro. I have attached a photo of the advertised spectrum and actual spectral readings.

I expected it to be off a little, but it is missing a big chunk of red at 660 compared to what is advertised. On a side note, I did not buy this to measure spectrum, and I am super happy with my purchase even if it didn’t measure spectrum at all, but if it it has the feature, I am gonna play with it.

So i guess my question is, what kind of accuracy can be expected for spectrum readings?

1 Like

From HLG’s website

Diablo spectrum here and here.

Perhaps the difference is due to the age of the light. If CK’s light is an earlier model, it could well have a different spectrum than newer models.

The light is <2 months old, newest production, and not the R spec. The spectrum chart I posted is correct for the model of light.

I am no light junkie, I could of easily took an incorrect measurement somehow, but i repeated the process several times and got similar results each time.

The Pulse Pro isn’t a high resolution spectrometer (those types of devices more than a thousand dollars typically), it could be that the 660nm peak falls between two measurement points and ends up being underreported. Aside from the missing 660nm peak, the rest of the spectrum looks to be pretty good.

2 Likes

Have the sensors in the different devices been compared or calibrated against an integration sphere and known calibration lamp? We might be able to tease out various sensitivities to see if there is a dip around 660nm and elsewhere.

In case it helps in your own investigations or anyone else’s, I understand the spectrometer implementation in the Pulse Pro is an OSRAM AS7341, 11-channel spectral color sensor. I presume they are using this to estimate PPFD, which is how the Pulse Pro can provide “PPFD” readings without an onboard quantum sensor. They can measure spectral readings across the channels and, with calibration, estimate what PPFD might be.

It’s listed as covering 350nm to 1000nm, with 8 channels centered in visual spectrum, plus one NIR, and a clear channel. And channel 11 used for flicker detection.

The channels are centered on the following wavelengths:

  1. 415
  2. 445
  3. 480
  4. 515
  5. 555
  6. 590
  7. 630
  8. 680
  9. 910
  10. Clear channel for light source detection
  11. Flicker detection channel

The original poster’s issue, I would presume, is due to a gap in coverage between channels 7 and 8 on the light spectrum. From the AMS datasheet, channel 7 has a spectral minimum of 620nm and max of 640, centered on 630. Channel 8 has a spectral coverage of 670-690. OP said the missing chunk of red was at 660nm, which would be consistent with the underlying optical gap between 640-670nm.

That is essentially what Peet said, just in more words: the photons in coverage gaps between channels are getting under-reported. The more photons a light pushes between those channels, the amount of under-reporting would increase proportionately, I think. Which would probably affect PPFD measurements, as well.


1 Like

Thank you, @terpasaurus.midwest. This is a brilliant answer. Knowing that channel 7’s width is 620-640, and 8 is 670-690, this gives me numbers for what @peet said. Thank you. I will look up the docs for the OSRAM AS7341.

1 Like

No problem. Keep in mind the posted integration times on the referenced datasheet in my screenshots. The sensor provides 3 knobs to handle the calculus involved in measuring how many photons are reported. It’s actually integrating how much voltage charge accumulated on the sensor over time but as a digital number, and these parameters allow you to control the sizing of this window.

  • AGAIN (gain): a multiplier between x0.5 and x512, in 11 step increments (doubling each step)
  • ASTEP (integration step size)
  • ATIME (integration time)

Changes in any of these values will alter the reported measurements. They are there for sensitivity tuning; dealing with oversaturation in high light environments or the opposite in low light. For example, each channel I think can only report a value up to 65535 due to programming constraints. If your light was super strong or too close to the sensor, it’s possible each channel might report 65535 and be meaningless for you.

The knobs give you the ability to adjust (what I think of as) the shutter speed and exposure time of the sensor reporting. So you can make it stay open for less time (less photons/electrical charge gets reported) to make the readings become sensible/below 65535.

The formula for the integration is:

t = (ATIME + 1) x (ASTEP + 1) x 2.78 µS

What I don’t know, is if Pulse exposes those knobs to the user and what values they use, if not. (I don’t own a Pulse Pro.) The datasheet above is using an AGAIN of 64x and an integration time of 27.8ms. If that’s not the same as what Pulse has configured, then your irradiance responsivity values will be different than documented.

I assume Pulse tested the sensor against various commonly used commercial lights in the 1000W+ ranges and above to adjust these knobs so most folks shouldn’t need to worry about them. But if you’re trying to do anything precise and are using the vendor reference values, keep in mind this may be a cause of wildly incompatible values unless you know the 3 variables.

Is it possible to tweak these channel settings? Either by Pulse or by us ?

It seems like 660nm is a pretty important frequency for growing cannabis; what with there being a phytochrome peak right there, and with most grow lights on the market using discrete 660nm chips, it seems like accuracy could be massively improved by placing one of the channels to better capture the 650-670nm range.

@terpasaurus.midwest Very well worded and knowledgeable answer, you’re pretty spot on. As Peet mentioned, the Pro won’t be as granular or accurate as a stand-alone $1000+ spectrometer since we use a bunch of different calculations and an algorithm to “estimate” the PPFD/PAR values.

We actually did a test a few years back whenever we originally launched the Pro and compared it to some other industry standards. TL:DR - It’s pretty solid minus a few edge cases (In this instance the small gap in 660nm coverage causing the underreport) - http://support.pulsegrow.com/en/articles/5909944-how-accurate-are-pro-par-ppfd-spectrum-measurements

For anyone curious, here’s a look at the technical specs for the Pro spectral sensor:

  • PPFD (PAR) Range: 400-700nm

  • PFD Blue Range: 400-500nm

  • PFD Green Range: 500-600nm

  • PFD Red Range:600-700nm

  • Worst Accuracy: ±(10 umol/s/m2 + 10%)

  • Best Accuracy: ±(5umol/s/m2 + 2%)

Accuracy will depend on the type of light and the current version of our algorithm. Leaning into what @Oli_Dadswell mentioned, this might be possible with algorithm tweaks instead of new hardware but I don’t work on that specifically so can’t make any promises. I will bring this up with our engineers though. Appreciate your guys’ discussion, feedback, and support :slight_smile:

Tagging @EBo for visibility.

Yeah, I figure something like the Hamamatsu sensor I mentioned would be better, but obviously push the device price up quite a bit and, obviously, there’s a lot of business nuance behind any sort of price change on the Pulse Pro. The Pulse Hub accessories might give you some flexibility to market an affordable spectrometer based on the Hamamatsu, for folks not keen on doing group buys and building things from scratch, without having to mess with pricing knobs on things like the Pulse Pro. And a spectrometer-only Hub sensor addon shouldn’t cannibalize Pro device sales.

I guess it would fit naturally to the CO2-1 addon device, but I’m not sure how low you’d be able to keep the price with the extra sensor. I guess it would depend on production volume, etc., the price I pay for a group buy I’m sure is way more than you would, I assume. But if I was Joe Grower with a hub already, I’d fork over $300-350 for high quality spectrometer if I couldn’t DIY. I’d even consider buying one at a higher price to save me the time DIYing.