
Lots of updates lately 
I’ve accumulated a list of bugs, nits, and enhancement suggestions. Sorry if its a lot or sounds nit-picky. However you’ve been receptive to my reports/requests in past and it comes from a place of love.
I also realise that you might not agree or be willing/unable to put form the engineering effort required for all this…
All issues reported occur on both desktop as well as iOS version unless noted device details at end.
Enhancement Request: CO2 color hard to read in dark mode
Purple is a dope color, but in dark mode it can be extremely hard to read. A brighter color would be ideal:

^good example, look hard
Enhancement Request: Add target VPD to THV sensor
Similar to how Pulse One and Pulse Pro have this feature. I really do get value out of the “Adjust your temp X or your Humidity Y to hit your target VPD” when in chart view, and I’d hope you can enable that for this sensor.
Enhancement Request: Add "all-devices" Pulse API endpoint
Looking over the docs I don’t see an endpoint similar to the one the app makes when loading the dash. It calls
"https://app.pulsegrow.com/api/all-devices" which returns all the data on you dashboard and the last hours worth of data points for each parameter which I assume is to build out the graph. Currently I’d need to make multiple different calls to get all that data, which is what I haven’t done it. Being able to hit a single endpoint like "https://api.pulsegrow.com/all-device"with my api key would be real handy.
Issue: inconsistencies in labeling/asset issue in Zones view
These are all real minor ui bugs but when I open zones and then click into where I see all the graphs :
- nit: Pulse Pro asset has non-transparent background in the circle part. Not clear if intentional. Apparent in darkmode.
- chart hover labels are slightly inconsistent when comparing Pro/One vs Hub/Sensors (Temp vs Temperature, RH vs Humidity, Dew Point vs DP) (red Label)
- device/sensor name displayed in chart hover points. Not sure I see the value on graphs with a single device data source. It would make much more sense to change the main label above the chart (ex: Thv-1 or Pulse Pro) into whatever the user has named their unit, Unless the intention is to graph multiple of the same unit on a single graph? (blue label)
- nit: Pulse pro chart hover view missing “F” unit. (orange label) (I also noticed Humidity lacks a RH).

Issue: display nits for dashboard
Since the inclusion of Hub products I’ve noticed some inconsistencies in labeling and UI/UX between those and Pulse Pro/One products
- device/sensor labels differ. Pulse One/Pro are displayed as links, and Hub/Sensors (red labels)
- labeling difference between One/Pro and Hub/Sensors, seems to mirror behavior described in previous issue.
- red block displayed when alert present. Happens on both One/Pro and Hub sensors. (yellow arrow)
- label inconsistencies: Temp vs. Temperature, RH vs. Humidity. (orange arrows)
- nit: capitalization on alert badges: Co2 > CO2 and Vpd > VPD. (also orange arrows)


Issue: zone dash view label issues
When the zones dash view if you have a mix of hub/pulse one or pro, there will be labeling inconsistencies.
- Repeat from above but Temp vs Temperature, RH vs Humidity, etc etc. (orange label)
- nit: update LightLux to just Light to match device dashboard. (red label)
- nit: update Co2 > CO2 (blue label)
- nit: missing PPM label.

Issue: charted data persists even when disabled
If you deselect a data source from any Hub sensor to remove it from the chart, when you reopen the chart again the de-selected source will persist.
Steps:
- from dash open THV-1 sensor
- notice it displays multiple types of data (temp, rh, etc)
- de-select dew point, and notice it is removed from the chart
- return to dash then reenter chart view, notice dew-point is selected and charted even though it was previously disabled.
Expected behavior: Mimic Pulse Pro and Pulse One behavior which persists these preferences between views
Issue: all app gallery links don't work
Noticed all placements that links to app gallery don’t resolve to and actual app… don’t think people use that store for app much in 2023.
Issue: setting setting an alert for the Hub results in logout**
From dashboard if you select the Hub itself, select alerts, and attempt to enable wifi/power outage alerts the API returns a “403 forbidden” which forces client back to login page and user needs to re-authenticate.
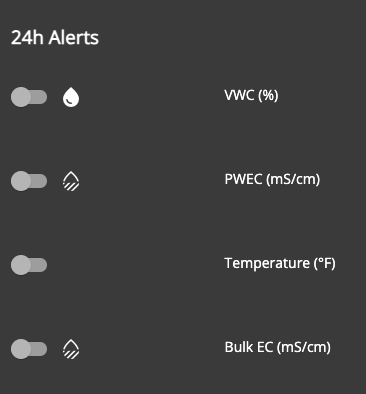
Issue: VWC template alerts missing temperature asset
If you attempt to setup a template for a VMC sensor it appears the temperature asset is missing. Possible this persists on the general VMC alerts page as well.
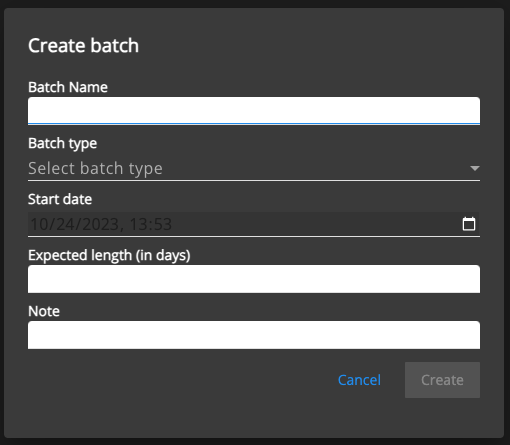
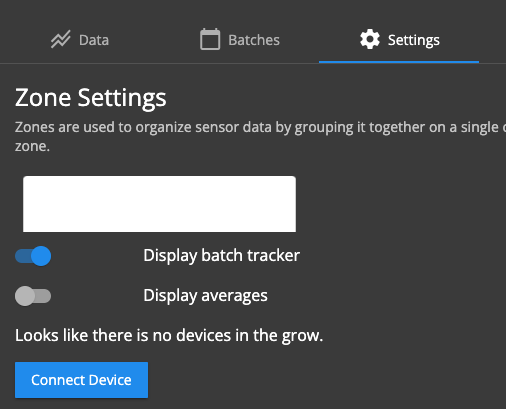
Issue: darkmode issues with batch/create batch
Seeing darkmode issues with create batch/batch modes. If I go into zones and create a new batch then I end up with the following UI bugs.
Steps to reproduce:
- start with fresh session.
- select zones, then select a pre-existing zone.
- select batches, notice everything looks fine.
- select “Start new batch”, notice UI issue immediately happens.
- check the documented locations (listed below) and notice UI issues that will persist until the app refreshed/force quit.
*NOTE: This happens on both iOS and desktop, however differences are noted. Also force quitting or force refreshing will resolve the issue until invoked again. Possible other triggers exist.
Know locations that the issue presents itself:
-
Create batch screen
-
Viewing existing batches (this issue does not occur on mobile)
-
Zone settings
-
main dashboard - search devices/ sort and filter
-
Exports - after clicking “new export”
-
Settings - edit location name, users, dropdown menu(mobile only)


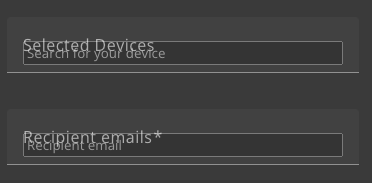
Issue: new exports screen has double text labels
When select Export, then New Export, the creation screen has double labels displaying for device and recipient emails
Enhancement: make login page and loading transition screen display based on system theme default
I know you can’t know what a users preference is until after login, but perhaps the login/loading state can reflect device theme defaults? It’s just an assault on the eyes to refresh my darkmode pulse app in the middle of the night only to be blasted with the the entire white screen loading screen.
Issue: Pull to refresh doesn't respect darkmode
If you pull to refresh on mobile as a darkmode user, the pulled down header isn’t in darkmode
Note: mobile only issue.

Issue: CO2 unit missing from zone view
If you select zones and have a pulse pro configured for the zone dashboard, the unit for C02 will not be displayed.
Device details:
Desktop
2019 Macbook Pro 16" OS 14.0 Sonoma Chrome browser Version 118.0.5993.88 (Official Build) (x86_64)
Mobile
iPhone 12 Pro Max iOS 17.0.3 Native Pulse app (most up to date)
Sorry about the length 
let me know if you require more details or if I wasn’t clear
Monstmash


