Pulse Hub alert threshold bug

Bug: Whenever a sensor connected to my Pulse Hub has an alert it will display incorrect error messages.
I will occasionally get an alert about exceeding a threshold set for my Pulse Hub sensors, but it will display incorrect data. This occurs both with my THV-1 sensor and my VWC-1 sensor.
Issue: Severe

Issue 1:
When a parameter exceeds any threshold it will trigger an alert for both the maximum and minimum set thresholds. Anytime you exceed the max or min bounds of the threshold the UI displays an alert for both. (see image 1)

Issue 2:
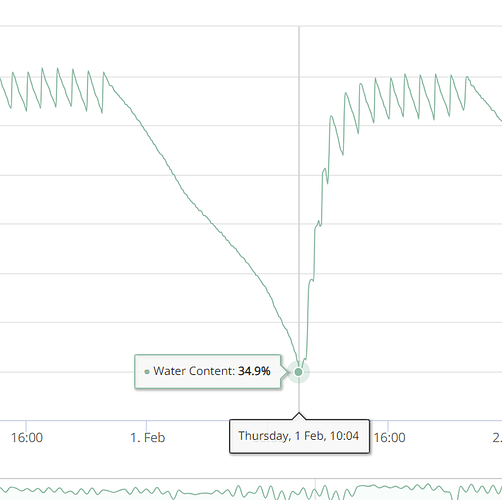
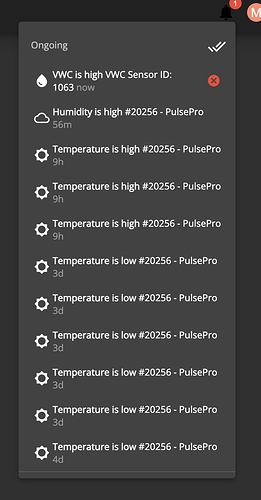
New alerts under the “black bell of death” are shown as being weeks old when they are just triggered. (see image 4)

Issue 3:
Sorry if I’m beating a dead horse, and it comes from a place of love, but alerts about the grow is Pulse’s thing and its been busted for more than a hot minute.

  • Alerts show inaccurate times, data is useless
  • If there are no alerts you can’t click the black bell to see dismissed/previous alerts any more
  • The journal doesn’t display all alerts.

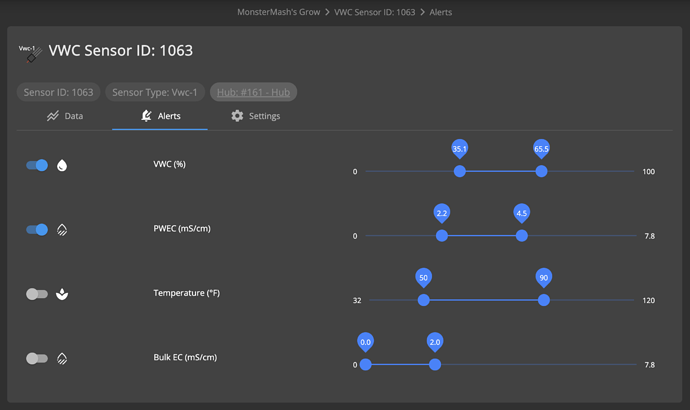
Image 1
Displays errors showing exceeding both min and max set thresholds

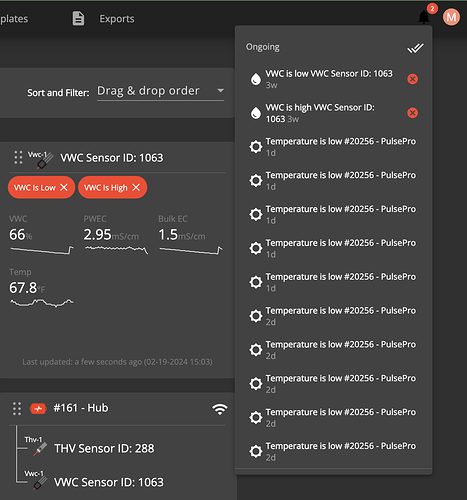
Image 2:
My current min/max thresholds

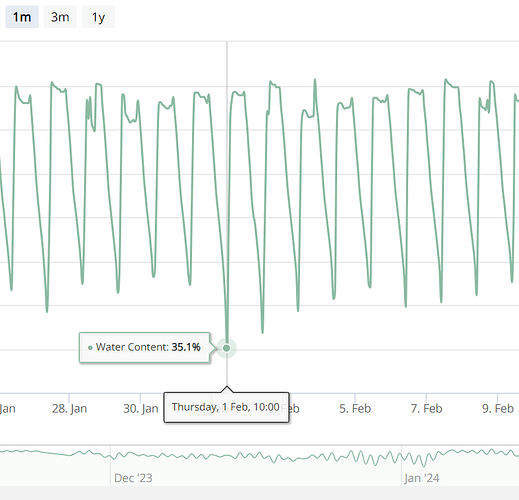
Image 3:
Display errors showing exceeding both min and max set thresholds and the graph of the last month and its min/max. Current parameter in last month only exceeds max threshold.

Image 4:
The black bell is only clickable when alerts are active and all Hub connected sensors give incorrect data.

@monstermash Hi there and once again thank you for your feedback.
This seems pretty serious and i will try to get to this asap

@monstermash Thank you for all your feedback.
I’m currently working on resolving the false alert issue and trying to locate the bug.
We were not able to reproduce your issue as of right now.

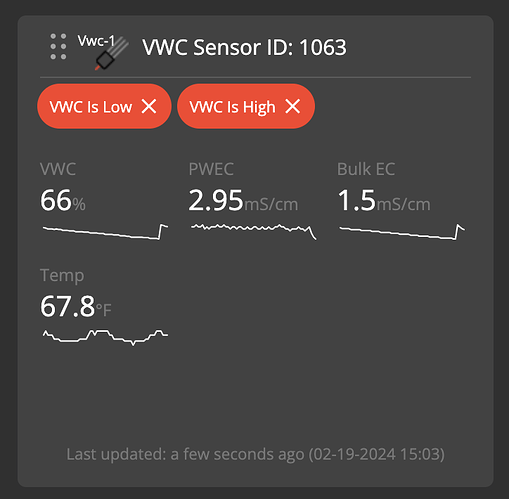
The alerts you had for your vwc sensors are infact three weeks old, i just checked in the database.

65.7 is the triggering value for the high Threshold, happened on - 1/31/2024 1:04:30 AM
35 is the low triggered threshold.


here’s a screenshot of your chart.

However, they should have been auto-resolved much earlier so there’s def something funky going on.

My theory is that the alerts are triggered fine, but they did not autoresolve and cause confusion

We would really appreciate if you help us with the following details:

  1. Does this happen for you every time you get go over your threshold?
  2. You did not click dismiss for these thresholds? They auto-resolved today? (19 of Feb)
1 Like

Thank you for the quick reply!

  1. Does this happen for you every time you get go over your threshold?

I’ve been consistently seeing this issue with both the THV-1 and VWC-1 sensor every time I exceed either the upper or lower bounds

  1. You did not click dismiss for these thresholds? They auto-resolved today? (19 of Feb)

Typically I either dismissed from the bell (hitting the double check mark).
Sometimes it auto resolves and the alerts disappear from the screen after the sensor goes back
Additionally I’m fairly confident I’ve dismissed it from the main screen (image 1)

I’ll capture my session today when I dismiss the warning to see if there are any obvious client/API issues.

Thank you once more, we are actively trying to pinpoint the issue.
There’s definitely something off, but this seems to be the first complaint so far about this particular issue.

As for the other points you made - got it. I’ll get to them after this one is resolved :slight_smile:

1 Like

Think i’ve got the bug to reproduce. Working on a fix.

1 Like

@monstermash after a lengthy investigation i believe i got it fixed.
Fix is deployed as of now.

Some dets - there was an issue with how already triggered thresholds were cached. The bug happened only in cases where a user got an alert, it was auto resolved and then they got the same alert again.

Thank you for taking the time for such a detailed post. Surprisingly, this issue was only noticed now.
Please let us know if there’s more trouble.

I’ll check out the timeline / calendar stuff in the upcoming days.

1 Like

Awesome. Thank you for the prompt fix. You guys rock. I will monitor and update if I notice the issue reoccur. Sorry I didn’t follow up this afternoon, was super busy today.

1 Like

@Ggofman Just saw an alert pop up that had a time of “now” so I think you found the culprit. :slight_smile:

1 Like

@monstermash small question on you feedback.
The alerts bell is not clickable when there are no alerts. It also fetches the last 5 resolved thresholds.

We don’t really thing it makes sense to have it clickable unless there are ongoing notifications?

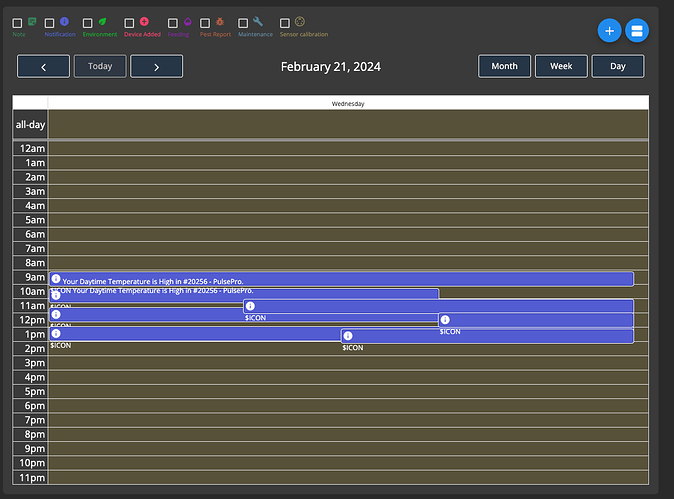
It used to be clickable and you were able to see previous alerts(that are now resolved). I find that useful as sometimes by the time I get to the page the alert has self resolved. The calendar has some of that data, but its not a great user experience:

I can’t be the only person that reviews resolved alerts?

1 Like

Ah, yeah. But it only pulls up the last 5 resolved alerts. I’ll check what the team thinks about this.

As for the journal entries - they seem to be empty for alerts that are off the hub. I am working on a fix right now and hope to deploy it today.
It will not back populate the empty journal entries though.

Thank you once more for your patience.

I’m not clear on what you mean by “last 5”? If you are talking about whats displaying in the bell, I consistently see results greater than 5 like this:

Image 4 from my previous post above has 12 entries.

Almost none of whats displayed is recent, and most are days old. I’ve gotten 9 alerts about my VWC sensor today and several more from the THV and Pulse Pro, however I see alerts for 4 days ago. The feature feels pretty broken and has been for a while. (I reported it in November, right after it changed from gray to black and became unclickable without an active alert).

To be honest i’ve never used the journal/calendar view. Its a really bad way to present this kind of data. You can’t make heads or tails of anything in literally any view(month, week, or day) without clicking into individual alerts. Its got a lot of bugs: entire alerts are missing, lots of “$ICON” rendered, notifications have zero information contained within them, dark mode issues, and extremely challenging to use on mobile.

I guess my point is that bell is literally the only way to see any previous alerts without clicking thru every single entry. I’m hopefully the team will consider replacing the calendar and turning that tab into a dedicated alert/alert history page. I think the value of seeing that data in a easy to digest single view is way higher than relying on the calendar view for history.

Thanks again for all your time. Its really appreciated.

@monstermash I’ve deployed a fix based on your greatly appreciated feedback.
Hub alerts where indeed not popping up in the resolved subsection, i’ve also allowed it to be openable in the case of there being resolved thresholds with no ongoing ones.

I’m sorry there was a fare bit of bugs this time, but i hope it’s all solved now.
It’s critical for us for any alert related issues to be resolved as soon as they are reported.

As for having a better way of doing a retrospective - i agree with the points you made.
The journal is a journal, and it’s not really meant for data retrospectives. We do have some enhancements planned for this in the future, but they aren’t on the immediate list rn.

Thank you once more for your contribution.

1 Like

@Ggofman Thanks for the quick resolution. Seems to be working really well now. :smiley: