Add Variance to Summary Data

Just got my Pulse a couple days ago. Learning a lot from data and dialing my grow in accordingly. Would it be possible to add delta/variance/amount of swing/change to the tabular summary data for each parameter below the charts?

It’s helpful to see how effective physical adjustments and settings to the grow space in reducing wide swings in temp, humidity, etc. Looking at the how the height the plots vary helps, but it would be cool to have some actual numbers to see as well.
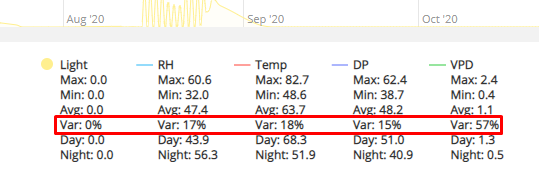
You provide:
Min
Max
Ave
Day
Night

Nice to have:
Variation - whatever you want to call it, but essentially the difference between the high and low points of each plotline.

1 Like

Do you mean just a difference between min and max, or something like standard deviation / variance

1 Like

Hoping to see numbers that show how much variation above/below the average. I think that falls under standard deviation, but I’m no statistician. :stuck_out_tongue_winking_eye:

It’s potentially another method of tuning the grow environment. Example: If you have an exhaust fan that’s on a thermostat, you can usually tell when it kicks on/off based on temp plot. How much it varies might depend on the speed of your fan (how many CFM) you’re moving. Lower peaks and valleys mean more consistent/stable, which generally is something to aim for. In this example, if there are big swings, might mean to the reduce fan speed to reduce variation. This also impacts humidity so you have to look at both.

Seeing deviation numbers might be helpful in example above. Thank you for reading this and for considering the suggestion.

1 Like

It’s added:

image

This is a “relative standard deviation”. https://www.statisticshowto.com/relative-standard-deviation/

2 Likes

Awesome! Thank you! Very helpful.

1 Like